

Every roofing contractor I know has the same dirty secret: their labor estimates come from gut feel, not actual data. Meanwhile, they're sitting on years of timesheet data that could make those estimates bulletproof. The problem? That data is scattered across handwritten sheets, different crew chiefs' notebooks, and whatever system payroll uses.
Getting from messy timesheets to clean labor hour estimates for reroof historical data isn't complicated. It just takes a systematic approach and some discipline around data collection. Once you build these tables, you stop losing money on underestimated jobs and stop scaring customers away with padded estimates.
The core problem: why timesheet data doesn't match estimate needs
Your timesheet shows "Johnson crew - 8 hours - Miller residence." Your estimate needs to know labor hours for a 28-square hip roof at 7/12 pitch with architectural shingles. See the disconnect?
Timesheets track payroll. Estimates need production rates. That gap is where most pricing mistakes actually come from. You end up using industry averages that don't match your crews, or you're guessing based on some job you half-remember from last spring.
The worst part is when a customer questions your pricing. They ask why their neighbor's roof cost $2,000 less, and you can't show them anything concrete. You say something vague about pitch and complexity. They think you're making excuses.
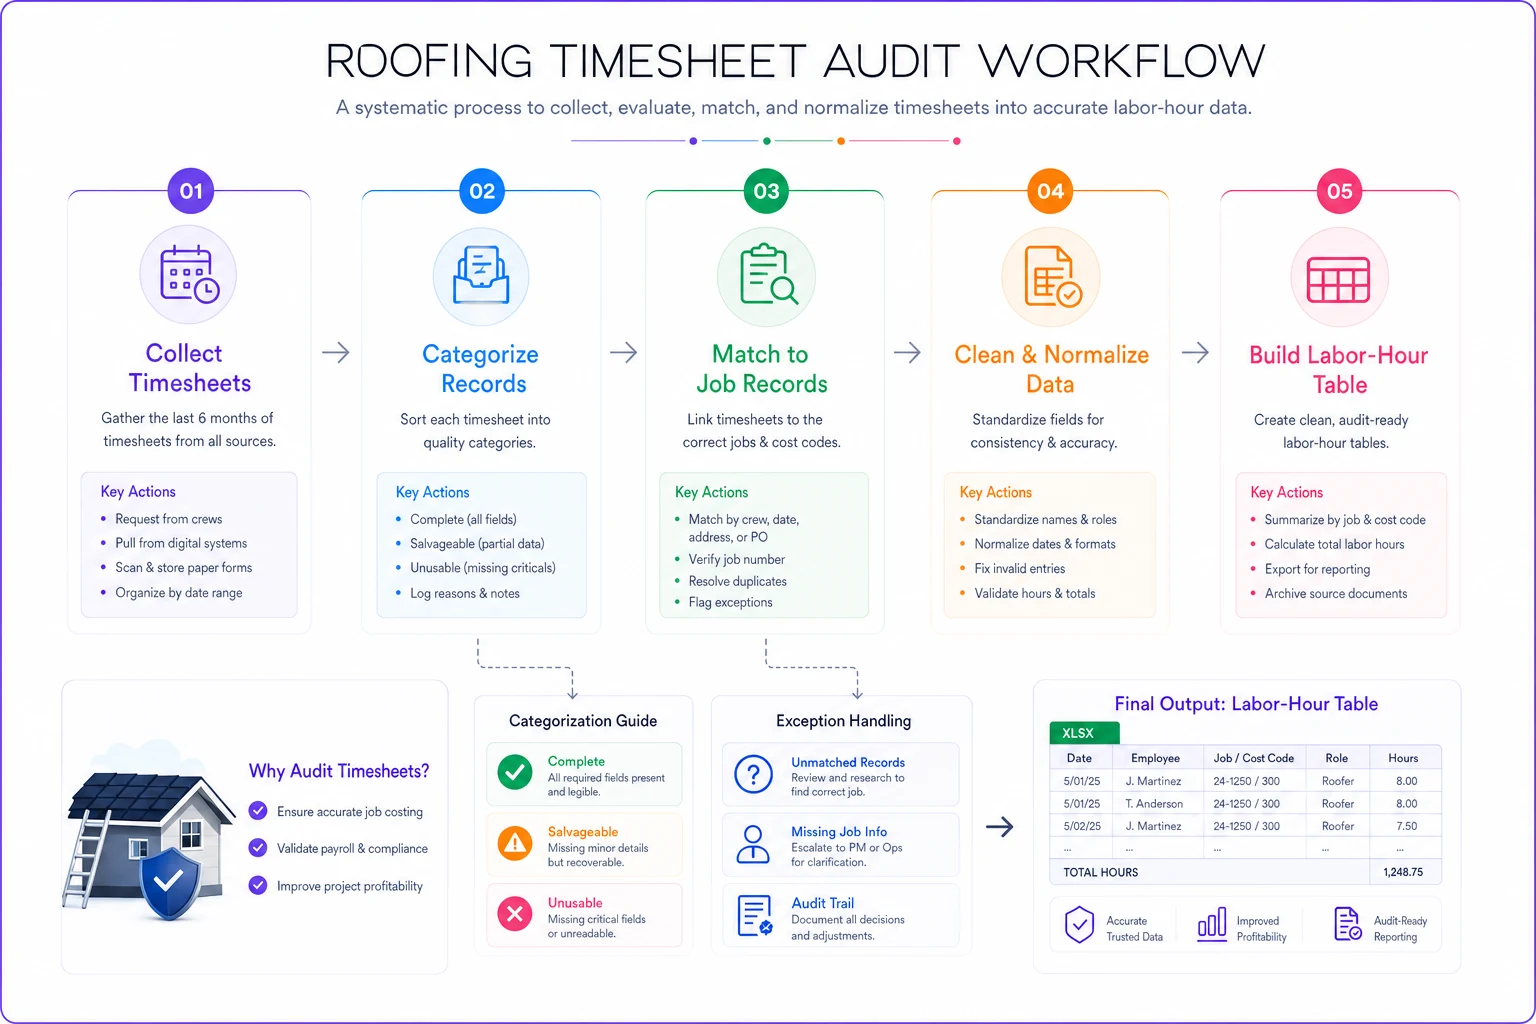
Start with what you actually have: the timesheet audit
Before normalizing anything, you need to know what data exists and what's usable.
Keep every roofing job on track and on time.
Roofyly helps you manage, schedule, and communicate every roofing project with precision and ease.
- Centralized project planning
- Real-time crew notifications
- Integrated scheduling & client updates
No credit card required
Pull six months of timesheets. Don't go crazy trying to digitize everything from the last decade. Six months gives you enough variety without drowning in paper. Look for:
Complete records that include:
-
Crew members present
-
Actual start and stop times
-
Job address or identifier
-
Weather conditions (even just "clear" or "rain delay")
Partial records you can salvage:
-
Missing exact times but have total hours
-
Missing one crew member's hours
-
Weather not noted but you can check historical data
Unusable records:
-
No job identifier
-
Hours that don't add up
-
Obviously wrong data (40 hours in one day)
From a typical six-month pull, expect roughly 65% complete records, 20% salvageable, and 15% trash. That's normal. The salvageable ones often become complete once you match them against other records like material delivery logs or permit dates.
A simple audit flow helps keep this manageable.
The salvageable ones often become complete once you match them against other records like material delivery logs or permit dates.
Match timesheets to job characteristics
This is where most contractors give up. They have a pile of timesheets and a separate pile of job details, and connecting them feels like too much work.
Start with a simple job characteristics table. Don't overthink it:
| Job ID | Address | Roof Type | Squares | Pitch | Material | Tear-off? |
|---|---|---|---|---|---|---|
| 2024-031 | 123 Oak St | Gable | 22 | 5/12 | Arch shingle | Yes |
| 2024-032 | 456 Pine Ave | Hip | 31 | 8/12 | Arch shingle | Yes |
| 2024-033 | 789 Elm Dr | Gable | 18 | 4/12 | 3-tab | No |
Now match each timesheet entry to its job ID. Cross-reference addresses, dates, and crew assignments. Yes, it's tedious. But you only need to do it once to build your baseline.
The matching process reveals gaps fast. You'll find timesheets for jobs with no measurements, or job files with no timesheet data. Mark the gaps but keep moving. Perfect data doesn't exist.
Clean the chaos: practical data rules
Round to quarter hours Nobody works exactly 7 hours and 18 minutes. Round everything to 15-minute increments. This matches how most crews actually think about time anyway.
Keep original raw entries alongside rounded values so audits can trace adjustments back to source timesheets.
Identify and tag outliers That 14-hour day? Either someone forgot to clock out, or you hit unexpected repairs. Flag anything over 10 hours or under 4 hours for manual review. Don't delete outliers — tag them. Sometimes that 14-hour day was real because you found rotten decking.
Standardize crew size A "crew" might be 3 people on Monday and 5 on Tuesday. Normalize everything to labor-hours, not crew-days. Three people working 8 hours = 24 labor-hours. Simple math, but contractors mess this up constantly.
Account for non-productive time Lunch, safety meetings, material runs — these eat about 15% of logged hours. You can either subtract this from your totals or build it into your final estimates. Pick one method and stick with it.
Weather adjustments Rain delays and extreme heat slow production. Don't delete these days — mark them separately. You need to know both ideal and real-world rates.
Build your normalized tables
After cleaning, you can finally build labor-hour tables. Start simple, then add complexity as your data improves.
Basic Table: Labor Hours by Roof Type and Size
| Roof Type | Size (squares) | Avg Labor Hours | Sample Size |
|---|---|---|---|
| Gable | 15-20 | 32 | 12 jobs |
| Gable | 21-25 | 44 | 18 jobs |
| Gable | 26-30 | 56 | 14 jobs |
| Hip | 15-20 | 38 | 8 jobs |
| Hip | 21-25 | 52 | 11 jobs |
| Hip | 26-30 | 66 | 9 jobs |
Notice the sample sizes. Don't trust averages from fewer than 5 jobs. Mark those cells as "preliminary" until you collect more data.
Intermediate Table: Add Pitch Factor
| Roof Type | Size (squares) | Pitch | Avg Labor Hours | Variance |
|---|---|---|---|---|
| Gable | 21-25 | 4/12-6/12 | 42 | ±4 hours |
| Gable | 21-25 | 7/12-9/12 | 48 | ±6 hours |
| Gable | 21-25 | 10/12+ | 54 | ±8 hours |
Variance matters. Wide variance usually means something else is affecting the numbers — crew experience, access issues, something. Investigate the high-variance jobs before you assume your formula is right.
Advanced Table: Crew Performance Modifiers
| Crew Chief | Roof Type | Speed Modifier | Quality Issues |
|---|---|---|---|
| Johnson | Gable | 0.95x | None |
| Martinez | Gable | 1.15x | None |
| Thompson | Hip | 1.0x | 1 callback/month |
This table is political dynamite. Use it for internal planning, not crew reviews. The goal is accurate estimates, not performance management.
The normalization formula that actually works
Here's the basic formula most contractors end up using:
Base Labor Hours = (Squares × Type Factor × Pitch Factor) + Tear-off Hours
Where:
-
Type Factor
Gable = 1.0, Hip = 1.2, Complex = 1.5
-
Pitch Factor
4/12 = 1.0, 8/12 = 1.2, 12/12 = 1.5
-
Tear-off Hours
0.5 hours per square (if applicable)
Then adjust for:
-
Crew efficiency (0.9x to 1.2x)
-
Access issues (+10% for difficult access)
-
Material type (architectural vs. 3-tab vs. premium)
A real example: 25-square hip roof, 8/12 pitch, tear-off required, average crew
Base = (25 × 1.2 × 1.2) + (25 × 0.5)
Base = 36 + 12.5 = 48.5 labor hours
If your average crew is 4 people, that's roughly 12 hours, or about 1.5 days at 8 hours each.
Common patterns hiding in your data
After going through this process with a lot of contractors, certain things come up almost every time:
The Monday/Friday problem: Production drops 15-20% on Mondays and Fridays. Crews show up late Monday, leave early Friday. Plan accordingly.
The third-day surge: Multi-day jobs see peak productivity on day three. Days 1-2 involve setup and figuring out quirks. Day 3 hits rhythm. Day 4+ fatigue sets in.
Crew size sweet spot: 4-person crews generally show the best hours-per-square ratio. 3-person crews work longer. 5+ person crews trip over each other.
The "almost done" slowdown: The last 10% of any job takes 20% of the time. Finishing work, cleanup, and detail work kill productivity metrics.
Red flags in your normalized data
Sometimes the math surfaces uncomfortable things:
Huge variance between similar jobs: Usually means someone's padding hours or your job classification is too broad. A "gable roof" category might need splitting into simple gable vs. gable with dormers.
Consistent overruns on specific material types: Your crews might need training on that product, or your supplier might be delivering inconsistent quality.
Perfect consistency: If every 20-square gable takes exactly 40 hours, someone's faking the data. Real work has variance.
Seasonal swings over 30%: Some seasonal variation is normal, but massive swings suggest other issues like crew turnover or equipment problems.
A real contractor's normalization journey
Consider a regional roofing company operating across three counties. They had 8 crews, roughly 300 jobs per year, and no real idea why some jobs made money while others didn't.
Their timesheet "system" was crew chiefs texting hours to the office manager, who entered them in QuickBooks. Job details lived in the estimator's spreadsheets. Nobody had ever connected the two.
The data audit revealed that 40% of their timesheets had no job identifier — just customer names that might or might not match the estimate. Another 20% had hours but no crew size. The remaining 40% was workable.
After about three weeks of matching and cleaning, patterns started showing up. Their hip roof estimates were consistently 20% low. Not because of the roof type itself, but because hip roofs in their area usually meant older homes with access issues. The labor hour estimates for reroof historical data made this obvious once normalized.
They also found that one crew chief's jobs consistently ran 30% over estimate. Not because his crew was slow — because he was the only one properly logging material handling and cleanup time. Everyone else was underreporting.
Within six months of using normalized tables, their estimate accuracy improved from around ±35% variance down to ±12%. More importantly, they could defend their pricing with actual numbers.
Maintaining your tables: the part everyone skips
Monthly updates: Add new job data monthly, not daily or yearly. Daily is too much overhead. Yearly means your tables stay outdated for most of the year.
Quarterly reviews: Every quarter, recalculate averages and check for drift. If your averages are moving consistently in one direction, something changed — new crew members, different materials, modified processes.
Annual overhaul: Once a year, archive old data and rebuild from the last 12 months. Markets change, crews turn over, and your business mix probably looks different than it did two years ago.
Exception tracking: Keep a simple log of weird jobs. The house with three shingle layers. The tear-off that revealed massive rot. These exceptions explain outliers and sharpen future estimates.
Software automation: where it actually helps
Normalizing labor hour estimates from reroof historical data by hand works, but it's a grind. The right operational software turns this from a quarterly project into an ongoing process.
Modern platforms can pull timesheet data directly from your payroll system, match it to job records automatically, and flag outliers for review. Instead of spending days in spreadsheets, you're spending a few hours verifying and adjusting.
The real value is in pattern recognition. AI-powered systems catch things like "jobs estimated by Steve run 15% over when assigned to the Johnson crew" or "hip roofs in ZIP code 12345 consistently need extra labor." These insights take forever to find manually but surface quickly with proper automation.
Automated systems also maintain history in a way spreadsheets just don't. Every estimate references actual similar jobs, not just averages. When a customer questions your pricing, you can pull up five comparable roofs with real labor hours behind them.
The coordination improvement matters too. Estimators see real production rates. Crew chiefs understand where they stand. Operations managers catch problems before they compound. Everyone's working from the same data instead of separate assumptions.
Stop guessing, start measuring
Your competition is still estimating labor based on what they learned as apprentices. You could be building a competitive advantage one normalized timesheet at a time.
This process is tedious. But the alternative is continuing to lose money on underestimated jobs while losing bids on overestimated ones. The contractors who make it through the next decade will be the ones who actually know their numbers.
Start with your next six jobs. Track everything. Match timesheets to job characteristics. Build one simple table. Then expand from there. Within a year, you'll have labor estimates you can defend, price competitively, and actually profit from.
The messy timesheet data you've been ignoring is operational intelligence. It just needs to be cleaned up and put to work. Your estimates will never be perfect, but they'll be based on your real crews doing real work on real roofs. That beats guessing every time.
Ready to elevate your roofing operations?
Join hundreds of roofing contractors using Roofyly to streamline workflows, improve crew coordination, and enhance client satisfaction.