


Most roofing companies don't have a data problem. They have a decision problem dressed up as a data problem.
Walk into almost any operation doing $3M+ a year and you'll find dashboards nobody looks at, a production spreadsheet three people maintain slightly differently, and a job-costing report that shows up two weeks after the crew already made the mistake it would have caught. Everyone technically "has the data." Nobody is actually deciding anything with it.
The shops running clean versus the ones running hot aren't separated by more measurement. It's fewer metrics, tighter rules, and pre-agreed triggers so the person on the roof — or the coordinator at the desk — knows exactly what to do the moment a number crosses a line. That's what data-driven roofing decisions actually look like in practice. Not a wall of charts. A handful of numbers, each tied to a required action.
Why "we track everything" quietly kills decision-making
There's a pattern that shows up constantly once a company gets past a couple of crews. Someone — usually an ops-minded owner or a sharp office manager — builds out reporting because they can feel money leaking. Job margins swing 15 points and nobody can say why. So they start tracking. Then they track more. Then they buy a tool that tracks even more.
Six months later they have 40 metrics and zero decisions.
The reason is boring but important: a metric with no owner and no trigger is just trivia. If your gross margin report shows a job came in at 28% instead of the 41% you bid, that's interesting. But interesting doesn't fix anything. What fixes things is a rule that says: any reroof that closes below 32% margin gets a 15-minute post-job review within 48 hours, run by the production manager, with the estimate and timesheets pulled side by side. Same number. Completely different outcome.
The other quiet killer is measurement drift. When two coordinators calculate "crew utilization" differently — one counts drive time, one doesn't — the number stops meaning anything, and people stop trusting it. Once a metric loses trust, it's dead. Nobody argues with a dashboard they don't believe.
So before adding a single new report, the real work is defining a defensible set of numbers, writing down exactly how each one is measured, and attaching a specific action to specific thresholds. Everything else is decoration.
The five-metric rule
You do not need 40 metrics. Across well-run residential shops, the operation is actually controlled by five or six numbers. Everything else is downstream noise.
Keep every roofing job on track and on time.
Roofyly helps you manage, schedule, and communicate every roofing project with precision and ease.
- Centralized project planning
- Real-time crew notifications
- Integrated scheduling & client updates
No credit card required
Here's a defensible core set. Notice each one has a clear measurement rule and a trigger — that's the whole point.
| Metric | How it's measured (the rule) | Green | Watch | Trigger action |
|---|---|---|---|---|
| Crew utilization | Productive install hours ÷ total paid crew hours, per week | 78%+ | 68–77% | Below 68% two weeks running → dispatch review + scheduling audit |
| Margin variance | (Actual GM% − bid GM%) per closed job | Within 4 pts | 4–8 pts off | 8+ pts below bid → mandatory 48-hr post-job review |
| Callback rate | Jobs needing a return visit ÷ jobs closed, trailing 30 days | Under 5% | 5–9% | 9%+ → QA sampling increases next 20 jobs |
| Cycle time | Contract-signed to install-complete, median days | On seasonal target | +20% | +30% over target → capacity + procurement check |
| Supplement approval | Approved supplement $ ÷ requested $ | 80%+ | 65–79% | Under 65% → adjuster documentation review |
Two things matter more than the exact thresholds. First, your numbers will differ — a steep-and-cut-up market runs different utilization than a tract-home reroof machine. Set your green zone off your own trailing 12 months, not a blog table. Second, the trigger action column is the actual product here. A metric without a required action is just something to feel anxious about.
Measurement rules are where most systems rot
Here's the part nobody wants to do, and it's the part that makes the whole thing hold up: writing down the definitions.
Take utilization. Sounds simple. It is not. Do you count the two-hour drive to a storm market as productive? Do you count a rained-out morning where the crew showed up and got sent home? Do you count punch-list return trips as install hours or overhead? Answer those once, write it down, and make everyone use the same math. The number itself matters less than the fact that it's calculated identically every single week.
A typical failure looks like this. A company sets a 75% utilization target. Crew A "hits" 82% because their foreman logs travel and material runs as productive time. Crew B posts 71% because their foreman only logs hammer-on-roof hours. Management praises Crew A and pressures Crew B. Exactly backwards. The metric didn't measure performance — it measured logging habits.
So your measurement rules need to lock down, in writing:
-
What counts (which hours, which dollars, which visits)
-
What's excluded (and where it goes instead — usually overhead)
-
The time window (weekly, trailing 30, per-job — pick one per metric and never mix)
-
Who owns the number (one name, not a department)
-
When it's frozen (a job's margin is final at closeout, not adjustable when someone's uncomfortable with it)
When these rules live in people's heads, they drift. When they live in your production system as fixed fields and calculated columns, they hold. That's a big part of why shops move off spreadsheets — not because spreadsheets can't do math, but because they let three people quietly define the same metric three different ways.
Triggers: the difference between a report and a decision
A trigger is a pre-agreed "if this, then that." The reason to decide the action before the number goes red is simple: in the moment, everyone rationalizes. "That job was weird." "The homeowner was a nightmare." "We'll catch it next time." Individually every excuse is plausible. Collectively they're how a shop bleeds four margin points a year and never notices.
Good triggers share a few traits:
-
They're numeric, not vibes. "Utilization is low" is not a trigger. "Below 68% for two consecutive weeks" is.
-
They name a required action, not a suggestion. The action fires automatically; the only decision left is how to execute it.
-
They name an owner and a clock. "Production manager, within 48 hours." No owner, no clock, nothing happens.
-
They escalate. First breach = review. Repeat breach = structural change (re-crew, re-price, re-vet a sub).
Here's how one trigger actually plays out. Say your callback rate on a trailing-30 basis crosses 9%. The trigger doesn't say "investigate quality." It says: increase QA spot-check sampling on the next 20 jobs, flag the two crews with the highest callback contribution, and pull the closeout photos on the last five callbacks to look for a pattern. Maybe you find it's one crew's flashing detail. Maybe it's a single underlayment lot. Either way, in a week you're acting on a cause instead of debating whether quality "feels" worse lately.
The number crossing the line starts a defined process, so the response doesn't depend on whoever happens to be paying attention that day.
What breaks as you scale
The single-crew shop doesn't need any of this. The owner is the metric system — he was on the roof, he knows why the job ran long, he'll fix the bid himself. Everything lives in his head and that's genuinely fine at that size.
It stops being fine somewhere around the second and third crew, and it breaks hard at four-plus. Here's the progression, because knowing where you are tells you what to build next:
-
One crew No formal metrics needed. The owner's judgment covers it. Building a dashboard here is a waste.
-
Two to three crews The owner can't see every job anymore. This is where measurement rules have to get written down, because now two foremen are reporting and their definitions are diverging. First real need: utilization and margin-variance defined identically across crews.
-
Four to six crews Judgment doesn't scale. You need triggers, because the owner physically can't review every job in time to catch the mistake. Post-job reviews become rule-based, not gut-based.
-
Seven-plus crews / multiple markets Now you need the metrics to roll up and drill down — company margin variance means nothing if you can't split it by crew, by market, by product line. This is where spreadsheet stacks collapse under their own weight.
The failure at each stage isn't dramatic. It's a slow blurring. The owner used to know instantly which crew was slow; now it takes a week of arguing over whose spreadsheet is right. That week of arguing is the cost of not having locked-down definitions and triggers. Multiply it across a season and it's real money — a couple of margin points across your whole board, which on $4M is not a rounding error.
A real scenario
A residential reroof company running four crews, doing somewhere around $4.2M a year, had the classic setup: a production spreadsheet, a separate job-costing report from the bookkeeper, and QuickBooks. Everyone "watched the numbers." Nobody could tell you within ten points what any given crew's real margin was until a month after the job closed.
Their actual problem surfaced in the review: they were losing roughly 6–7 margin points on complex cut-up roofs specifically, and they'd been losing it for over a year. The estimating template used a flat labor allowance regardless of roof geometry, so every steep, multi-facet job quietly ate the margin. The data to see this existed the whole time — it was just spread across three files that never sat next to each other.
They didn't add metrics. They cut down to five, locked the definitions, and set two triggers: any job 8+ points below bid gets a 48-hour review, and any cut-up roof over a complexity threshold gets a second estimating look before it's sold. Within a quarter, margin variance on complex jobs tightened up — not perfectly, but they stopped bleeding on the worst offenders. The bigger win was speed: post-job reviews that used to happen "eventually" now happened inside two days, while the crew still remembered the job.
Nothing exotic. They just stopped collecting data and started acting on it.
When a rules-based framework makes sense — and when it doesn't
It makes sense when you've got at least two or three crews, jobs vary enough that averages hide problems, and you're already tired of finding out about bad jobs weeks late. If you can't currently say which crew or which job type is dragging margin, that's the signal.
It's a bad idea when you're a single crew or a two-person shop still doing most jobs owner-on-roof. You'll spend more time maintaining the system than it saves. Judgment is faster than a dashboard at that size. Build this when judgment stops scaling, not before.
Who should not do this: anyone tempted to build 30 metrics "to be safe." That's not a framework — that's the exact problem this is meant to solve, rebuilt from scratch. The discipline is in what you leave out. More than seven or eight numbers and you've already lost the plot.
Where the tooling actually helps
You can run a small metrics framework on spreadsheets. Plenty of shops do, for a while. The reason most eventually move to an operational platform isn't the math — it's three failure points spreadsheets can't fix on their own.
Definition drift is the first one. When utilization is a calculated field in your production system, pulling from the same clocked hours every time, nobody can quietly redefine it. The rule is enforced by structure, not by memory.
Timeliness is the second. A trigger that fires two weeks late is useless. Operational software that watches thresholds and flags a breach the moment a job closes — routing it to the right owner automatically — is the difference between catching the problem while the crew still remembers the job and reconstructing it from cold notes. This is the honest, unglamorous place where AI automation earns its keep: quietly checking every closed job against your thresholds and surfacing only the ones that need a human, so nobody has to manually scan a report hoping to spot the outlier.
Roll-up and drill-down is the third. Once you're multi-crew or multi-market, you need the same number at the company level and the crew level without maintaining two spreadsheets that disagree by Thursday.
The tool isn't the framework, though. The framework is the five numbers, the written rules, and the triggers. Get those right on paper first. If you build the discipline before the software, the software just makes it faster. Build the software first and you'll automate a mess.
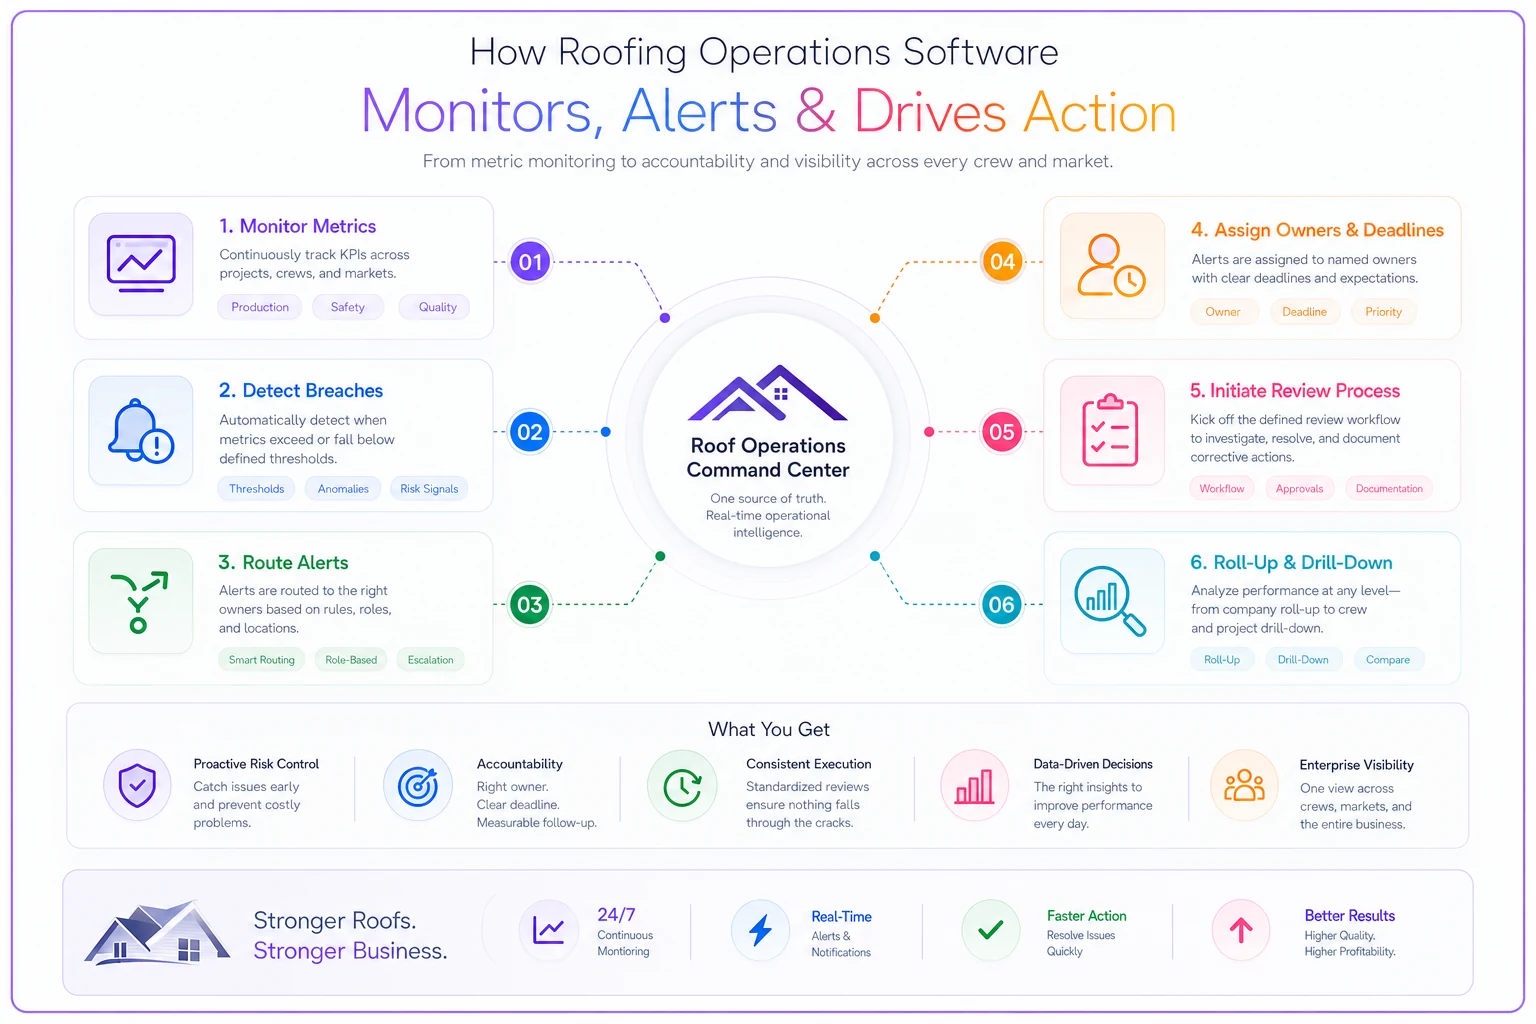
A simple workflow: the system detects a threshold breach, routes it to the owner with a deadline, and opens the defined review process.
The takeaway
The shops that make good field decisions aren't the ones with the most data. They're the ones who decided ahead of time which few numbers matter, exactly how those numbers are calculated, and precisely what happens when one crosses a line. That's the entire difference between watching your business and running it.
Start with five metrics. Write down how each is measured until there's no room for interpretation. Attach one required action to one threshold for each. Then hold the line — resist the urge to add a sixth, seventh, eighth until the first five are genuinely driving decisions. A small framework you actually act on beats a beautiful dashboard nobody trusts, every single season.
Start with five metrics. Write down how each is measured until there's no room for interpretation. Attach one required action to one threshold for each. Then hold the line — resist the urge to add a sixth, seventh, eighth until the first five are genuinely driving decisions. A small framework you actually act on beats a beautiful dashboard nobody trusts, every single season.
Ready to elevate your roofing operations?
Join hundreds of roofing contractors using Roofyly to streamline workflows, improve crew coordination, and enhance client satisfaction.